Mahindra Manulife Multi Cap Fund - Regular Plan - Growth
| Category: Equity: Multi Cap |
| Launch Date: 05-05-2017 |
| Asset Class: Equity |
| Benchmark: NIFTY500 MULTICAP 50:25:25 TRI |
| Expense Ratio: 1.8% As on (31-05-2025) |
| Status: Open Ended Schemes |
| Minimum Investment: 1000.0 |
| Minimum Topup: 1000.0 |
| Total Assets: 540.41 Cr As on (30-05-2025) |
| Turn over: 102% |
34.8153
-0.13 (-0.3835%)
16.69%
NIFTY500 MULTICAP 50:25:25 TRI 16.24%
PERFORMANCE of Mahindra Manulife Multi Cap Fund - Regular Plan - Growth
Scheme Performance (%)
Data as on - 13-06-2025Yearly Performance (%)
Fund Managers
FM-1 Mr. Manish Lodha FM-2 Ms. Fatema Pacha
Investment Objective
The investment objective of the Scheme is to provide medium to long term capital appreciation through appropriate diversification and taking low risk on business quality. The diversified portfolio would predominantly consist of equity and equity related securities including derivatives. However, there can be no assurance that the investment objective of the Scheme will be achieved.
MONTHLY LUMPSUM RETURNS ( Invested amount 1,00,000)
| NAV Date | NAV | Units | Market Value |
Returns (%) |
|---|---|---|---|---|
| 18-05-2017 | 10.0078 | 9992.2061 | 100000 | 0.0 % |
| 19-06-2017 | 10.2714 | 9992.2061 | 102634 | 2.63 % |
| 18-07-2017 | 10.3335 | 9992.2061 | 103254 | 3.25 % |
| 18-08-2017 | 10.3895 | 9992.2061 | 103814 | 3.81 % |
| 18-09-2017 | 10.7509 | 9992.2061 | 107425 | 7.42 % |
| 18-10-2017 | 10.7097 | 9992.2061 | 107014 | 7.01 % |
| 20-11-2017 | 11.056 | 9992.2061 | 110474 | 10.47 % |
| 18-12-2017 | 11.2199 | 9992.2061 | 112112 | 12.11 % |
| 18-01-2018 | 11.3328 | 9992.2061 | 113240 | 13.24 % |
| 19-02-2018 | 10.6885 | 9992.2061 | 106802 | 6.8 % |
| 19-03-2018 | 10.3981 | 9992.2061 | 103900 | 3.9 % |
| 18-04-2018 | 10.8545 | 9992.2061 | 108460 | 8.46 % |
| 18-05-2018 | 10.5832 | 9992.2061 | 105750 | 5.75 % |
| 18-06-2018 | 10.6151 | 9992.2061 | 106068 | 6.07 % |
| 18-07-2018 | 10.5139 | 9992.2061 | 105057 | 5.06 % |
| 20-08-2018 | 11.0577 | 9992.2061 | 110491 | 10.49 % |
| 18-09-2018 | 10.6791 | 9992.2061 | 106708 | 6.71 % |
| 19-10-2018 | 9.7336 | 9992.2061 | 97260 | -2.74 % |
| 19-11-2018 | 10.0722 | 9992.2061 | 100643 | 0.64 % |
| 18-12-2018 | 10.2982 | 9992.2061 | 102902 | 2.9 % |
| 18-01-2019 | 10.3195 | 9992.2061 | 103115 | 3.12 % |
| 18-02-2019 | 9.8738 | 9992.2061 | 98661 | -1.34 % |
| 18-03-2019 | 10.6532 | 9992.2061 | 106449 | 6.45 % |
| 18-04-2019 | 10.8423 | 9992.2061 | 108338 | 8.34 % |
| 20-05-2019 | 10.9109 | 9992.2061 | 109024 | 9.02 % |
| 18-06-2019 | 10.8941 | 9992.2061 | 108856 | 8.86 % |
| 18-07-2019 | 10.8225 | 9992.2061 | 108141 | 8.14 % |
| 19-08-2019 | 10.3875 | 9992.2061 | 103794 | 3.79 % |
| 18-09-2019 | 10.3102 | 9992.2061 | 103022 | 3.02 % |
| 18-10-2019 | 11.1346 | 9992.2061 | 111259 | 11.26 % |
| 18-11-2019 | 11.4586 | 9992.2061 | 114497 | 14.5 % |
| 18-12-2019 | 11.7171 | 9992.2061 | 117080 | 17.08 % |
| 20-01-2020 | 11.9475 | 9992.2061 | 119382 | 19.38 % |
| 18-02-2020 | 11.9194 | 9992.2061 | 119101 | 19.1 % |
| 18-03-2020 | 8.8228 | 9992.2061 | 88159 | -11.84 % |
| 20-04-2020 | 9.5856 | 9992.2061 | 95781 | -4.22 % |
| 18-05-2020 | 9.1368 | 9992.2061 | 91297 | -8.7 % |
| 18-06-2020 | 10.2728 | 9992.2061 | 102648 | 2.65 % |
| 20-07-2020 | 11.0499 | 9992.2061 | 110413 | 10.41 % |
| 18-08-2020 | 11.4372 | 9992.2061 | 114283 | 14.28 % |
| 18-09-2020 | 11.6655 | 9992.2061 | 116564 | 16.56 % |
| 19-10-2020 | 11.6742 | 9992.2061 | 116651 | 16.65 % |
| 18-11-2020 | 12.7431 | 9992.2061 | 127332 | 27.33 % |
| 18-12-2020 | 13.4947 | 9992.2061 | 134842 | 34.84 % |
| 18-01-2021 | 13.8966 | 9992.2061 | 138858 | 38.86 % |
| 18-02-2021 | 15.4475 | 9992.2061 | 154355 | 54.35 % |
| 18-03-2021 | 15.2388 | 9992.2061 | 152269 | 52.27 % |
| 19-04-2021 | 15.24 | 9992.2061 | 152281 | 52.28 % |
| 18-05-2021 | 16.6195 | 9992.2061 | 166065 | 66.06 % |
| 18-06-2021 | 17.6174 | 9992.2061 | 176037 | 76.04 % |
| 19-07-2021 | 18.4556 | 9992.2061 | 184412 | 84.41 % |
| 18-08-2021 | 19.0467 | 9992.2061 | 190319 | 90.32 % |
| 20-09-2021 | 19.8842 | 9992.2061 | 198687 | 98.69 % |
| 18-10-2021 | 21.9697 | 9992.2061 | 219526 | 119.53 % |
| 18-11-2021 | 21.1784 | 9992.2061 | 211619 | 111.62 % |
| 20-12-2021 | 19.5668 | 9992.2061 | 195515 | 95.52 % |
| 18-01-2022 | 21.5863 | 9992.2061 | 215695 | 115.69 % |
| 18-02-2022 | 20.029 | 9992.2061 | 200134 | 100.13 % |
| 21-03-2022 | 20.018 | 9992.2061 | 200024 | 100.02 % |
| 18-04-2022 | 21.2023 | 9992.2061 | 211858 | 111.86 % |
| 18-05-2022 | 19.1947 | 9992.2061 | 191797 | 91.8 % |
| 20-06-2022 | 17.3014 | 9992.2061 | 172879 | 72.88 % |
| 18-07-2022 | 19.029 | 9992.2061 | 190142 | 90.14 % |
| 18-08-2022 | 20.5729 | 9992.2061 | 205569 | 105.57 % |
| 19-09-2022 | 21.0725 | 9992.2061 | 210561 | 110.56 % |
| 18-10-2022 | 20.9159 | 9992.2061 | 208996 | 109.0 % |
| 18-11-2022 | 21.1563 | 9992.2061 | 211398 | 111.4 % |
| 19-12-2022 | 21.299 | 9992.2061 | 212824 | 112.82 % |
| 18-01-2023 | 20.907 | 9992.2061 | 208907 | 108.91 % |
| 20-02-2023 | 20.3401 | 9992.2061 | 203242 | 103.24 % |
| 20-03-2023 | 19.7477 | 9992.2061 | 197323 | 97.32 % |
| 18-04-2023 | 20.2137 | 9992.2061 | 201979 | 101.98 % |
| 18-05-2023 | 21.0695 | 9992.2061 | 210531 | 110.53 % |
| 19-06-2023 | 22.6413 | 9992.2061 | 226237 | 126.24 % |
| 18-07-2023 | 23.7128 | 9992.2061 | 236943 | 136.94 % |
| 18-08-2023 | 24.2849 | 9992.2061 | 242660 | 142.66 % |
| 18-09-2023 | 25.5306 | 9992.2061 | 255107 | 155.11 % |
| 18-10-2023 | 25.3834 | 9992.2061 | 253636 | 153.64 % |
| 20-11-2023 | 26.1994 | 9992.2061 | 261790 | 161.79 % |
| 18-12-2023 | 27.9645 | 9992.2061 | 279427 | 179.43 % |
| 18-01-2024 | 29.0034 | 9992.2061 | 289808 | 189.81 % |
| 19-02-2024 | 30.7617 | 9992.2061 | 307377 | 207.38 % |
| 18-03-2024 | 29.2817 | 9992.2061 | 292589 | 192.59 % |
| 18-04-2024 | 30.3727 | 9992.2061 | 303490 | 203.49 % |
| 21-05-2024 | 32.2497 | 9992.2061 | 322246 | 222.25 % |
| 18-06-2024 | 33.9099 | 9992.2061 | 338835 | 238.84 % |
| 18-07-2024 | 35.207 | 9992.2061 | 351796 | 251.8 % |
| 19-08-2024 | 35.4904 | 9992.2061 | 354627 | 254.63 % |
| 18-09-2024 | 36.7103 | 9992.2061 | 366817 | 266.82 % |
| 18-10-2024 | 35.9104 | 9992.2061 | 358824 | 258.82 % |
| 18-11-2024 | 33.2765 | 9992.2061 | 332506 | 232.51 % |
| 18-12-2024 | 35.4006 | 9992.2061 | 353730 | 253.73 % |
| 20-01-2025 | 33.5867 | 9992.2061 | 335605 | 235.61 % |
| 18-02-2025 | 30.5632 | 9992.2061 | 305394 | 205.39 % |
| 18-03-2025 | 30.6665 | 9992.2061 | 306426 | 206.43 % |
| 21-04-2025 | 33.2158 | 9992.2061 | 331899 | 231.9 % |
| 19-05-2025 | 34.3059 | 9992.2061 | 342792 | 242.79 % |
| 13-06-2025 | 34.8153 | 9992.2061 | 347882 | 247.88 % |
RETURNS CALCULATOR for Mahindra Manulife Multi Cap Fund - Regular Plan - Growth
Growth of 10000 In SIP (Fund vs Benchmark)
Growth of 10000 In LUMPSUM (Fund vs Benchmark)
Rolling Returns
Rolling returns are the annualized returns of the scheme taken for a specified period (rolling returns period) on every day/week/month and taken till the last day of the duration. In this chart we are showing the annualized returns over the rolling returns period on every day from the start date and comparing it with the benchmark. Rolling returns is the best measure of a fund's performance. Trailing returns have a recency bias and point to point returns are specific to the period in consideration. Rolling returns, on the other hand, measures the fund's absolute and relative performance across all timescales, without bias.
Market Cap Distribution
Small Cap
29.72%
Others
3.17%
Large Cap
40.8%
Mid Cap
26.31%
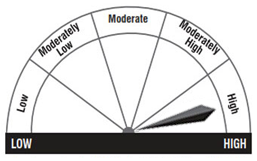
Riskometer
Key Performance and Risk Statistics of Mahindra Manulife Multi Cap Fund - Regular Plan - Growth
| Key Statistics | Volatility | Sharpe Ratio | Alpha | Beta | Yield to Maturity | Average Maturity |
|---|---|---|---|---|---|---|
| Mahindra Manulife Multi Cap Fund - Regular Plan - Growth | 13.97 | 0.93 | 0.25 | 0.97 | 6.56 | 2.0 |
| Equity: Multi Cap | - | - | - | - | - | - |
PEER COMPARISION of Mahindra Manulife Multi Cap Fund - Regular Plan - Growth
| Scheme Name | Launch Date |
1-Year Ret (%) |
2-Yrs Ret (%) |
3-Yrs Ret (%) |
5-Yrs Ret (%) |
10-Yrs Ret (%) |
|---|---|---|---|---|---|---|
| Mahindra Manulife Multi Cap Fund - Regular Plan - Growth | 05-05-2017 | 4.46 | 24.67 | 23.77 | 27.89 | 0.0 |
| WhiteOak Capital Multi Cap Fund Regular Plan Growth | 22-09-2023 | 11.51 | 0.0 | 0.0 | 0.0 | 0.0 |
| SBI Multicap Fund- Regular Plan- Growth Option | 05-03-2022 | 9.57 | 22.47 | 21.0 | 0.0 | 0.0 |
| Axis Multicap Fund - Regular Plan - Growth | 05-12-2021 | 7.78 | 27.36 | 26.62 | 0.0 | 0.0 |
| Invesco India Multicap Fund - Growth Option | 17-03-2008 | 7.6 | 24.34 | 24.14 | 25.32 | 14.3 |
| LIC MF Multi Cap Fund-Regular Plan-Growth | 31-10-2022 | 7.37 | 25.89 | 0.0 | 0.0 | 0.0 |
| Mirae Asset Multicap Fund - Regular Plan - Growth | 01-08-2023 | 7.28 | 0.0 | 0.0 | 0.0 | 0.0 |
| ICICI Prudential Multicap Fund - Growth | 01-10-1994 | 6.87 | 25.03 | 25.38 | 26.78 | 15.1 |
| Canara Robeco Multi Cap Fund - Regular Plan - Growth Option | 08-07-2023 | 6.16 | 0.0 | 0.0 | 0.0 | 0.0 |
| Edelweiss Multi Cap Fund - Regular Plan - Growth | 26-10-2023 | 5.63 | 0.0 | 0.0 | 0.0 | 0.0 |
PORTFOLIO ANALYSIS of Mahindra Manulife Multi Cap Fund - Regular Plan - Growth
Asset Allocation (%)
| Allocation | Percentage (%) |
|---|